Showing posts with label peak earnings. Show all posts

Tuesday, June 1, 2010

Tony Dwyer Is Not Alone..........Of Course It Is Still A Good Time To Buy, Buy, Buy.....

What a "surprise"......Keep the following stats in mind when the daily spin "stocks are cheap on forward pe´s" is hitting the MSM... If you want to hear the "rationale" for a 2000 S&P target in 2013 visit Tony Dwyer & his "brilliant playbook" UPDATE: A guy named Altucher is almost as good It's Not a 'V', It's Even Better, Look for New Highs by 2012 .... There maybe are legitimate reasons to buy stocks, but a favourable opinion from "Wall Street Finest" should definitely not play any role among your screening process .... Except you use them as a "contrary indicator".... ;-)

Welch "Überraschung"......Behaltet die nachfolgenden Daten im Hinterkopf wenn es wie tagtäglich in den Medien und auch der Fachpresse gebehtsmühlenartig wieder heißt "das Aktien auf Bewertung der 2011er Gewinne günstig sind"..... Ein eindrucksvolles "Schauspiel" in dieser Disziplin bietet Tony Dwyer mitsamt seinem "brillianten Playbook" für sein 2000 S&P Ziel im Jahr 2013 UPDATE: Dieser Typ ist mindestens ebenbürtig It's Not a 'V', It's Even Better, Look for New Highs by 2012..... Grundsätzlich mag es ja durchaus gute Gründe die für Aktien sprechen geben, man sollte aber sicherstellen das die Einschätzungen der "Experten" beim Auswahlprozess keinerlei Rolle spielen....Es sei denn man nutzt sie als Kontraindikator.... ;-)


Bespoke
Bloomberg surveys sell-side Wall Street strategists on a weekly basis for their year-end S&P 500 price targets. At the start of 2010, the average year-end S&P 500 price target was 1,225, which would have been a gain of just about 10%. As markets moved higher in the first quarter, strategists upped their year-end targets, and the current average target stands at 1,268. (In the table below, green shaded price targets are ones that have been increased so far this year. No strategists have lowered their targets since the start of the year.) A target of 1,268 translates into a gain of 13.68% for the year and 16.48% from current S&P 500 levels.

There are no strategists with year-end targets that are lower than the index's current levels.
Analysts Projecting 27% Gain in S&P 500 Defy El-Erian Bloomberg

Combined price estimates from more than 2,000 forecasters tracked by Bloomberg show the S&P 500 will rise 27 percent in the next year, the fastest projected rate since February 2009, data compiled by Bloomberg show.

The rally above 1,350 will be led by industries most tied to the economy, according to analysts who boosted individual share projections by an average of 0.9 percent in May, the 14th straight monthly increase.

Should analysts’ forecasts for a 27 percent gain in the S&P 500 come true, the gauge would climb to 1,360 by next May, the highest level since June 2008.

The real story here are not the S&P 500 targets from the "strategist" but that they have managed to increase the target since the beginning of the year.... Despite events like the Flash Crash ( "Cancel All Orders, Cancel All Orders....." ), "minor headwinds" when it comes to Sovereign Debt,China , for US companies an unfavourable strong $ , impact from the "Oil Spill" on drillers & still insolvent Banks it´s fair to say that ROSE COLORED GLASSES are still a must have item among way too many among "Wall Street Finest"... ;-)

Die eigentliche Botschaft sind nicht die angegebenen Kursziele, sondern vielmehr die Tatsache das diese trotz einiger unschöner Ereignisse die vermehrt seit Jahresbeginn aufgetaucht sind wie dem sog. Flash Crash ( "Cancel All Orders, Cancel All Orders....." ), "minimalen" Problemen wenn es um Sovereign Debt,China den für US Firmen ungünstigen "starken $" , seit dem BP GAU die Probleme der Ölförderer & die immer noch bemerkenswert schwachen Banken geht, munter fleissig angehoben worden sind..... Denke es ist keine Übertreibung zu sagen das eine ROSAROTE BRILLE unter etlichen von "Wall Street Finest" noch immer zur "Standartausrüstung" gehört.... ;-)

I´ll let "Mr. Anti Spin" David Rosenberg du some further "bashing"..... Do yourself a favour & subscribe to his free DAILY REALITY CHECK... SUPERB!

Überlasse es "Mr. Anti Spin" David Rosenberg noch mehr Wasser in den Wein zu gießen....Empfehle allen sich frei Haus die tägliche Dosis Rosenberg zu genehmigen....

"It’s also fascinating to read the “Ahead of the Tape” column in the WSJ today and to read about the fabulous earnings performance of U.S. companies — a revival built on a weak U.S. dollar, accelerating global growth, fiscal stimulus and a steep yield curve.

Meanwhile, the consensus has just now gone ahead and projected peak earnings for 2011 just as each of these main crutches are reversing course."

AMEN....

McKinsey: Equity Analysts Are Still Too Bullish via Barry

Moreover, analysts have been persistently overoptimistic for the past 25 years, with estimates ranging from 10 to 12 percent a year, compared with actual earnings growth of 6 percent.

Over this time frame, actual earnings growth surpassed forecasts in only two instances, both during the earnings recovery following a recession. On average, analysts’ forecasts have been almost 100 percent too high.”

This chart completes the not so glory picture when is comes to the credibility & reputation from "Wall Street Finest".... If you have the "guts" to read the "rationale" behind Goldmans bullsih call you should read Goldman: "We Raised S&P 500 EPS Estimates Despite Worst May Performance In Almost 50 Years"

Dieser Chart paßt hervorragend ins Bild unm das das wenig glorreiche Bild abrunden....Für alle die die Nerven haben und wissen möchten auf welchen "Modellen" die Schätzungen von Goldman basieren Goldman sollte Goldman: "We Raised S&P 500 EPS Estimates Despite Worst May Performance In Almost 50 Years" lesen....

UPDATE:

Profit-Margin Outlook for U.S. Is ‘Extremely Bad’: Chart of Day Bloomberg

Best Stocks Liked Least by Analysts Missing U.S. Gain Bloomberg

Friday, May 1, 2009

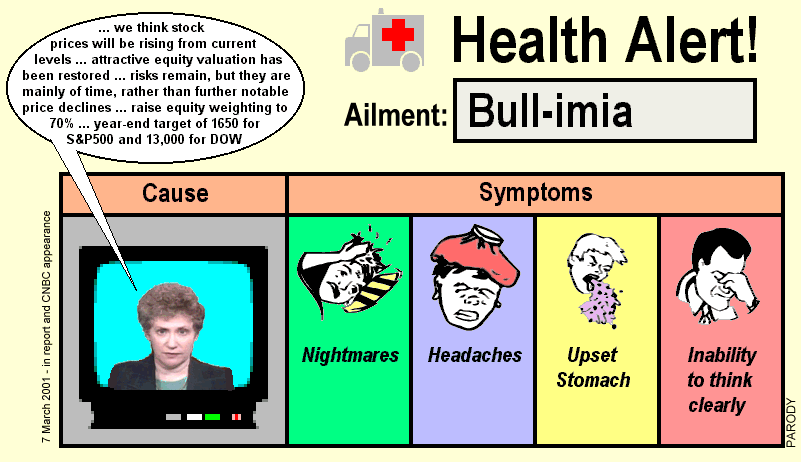
Abby Joseph Cohen 2009 vs Abby Joseph Cohen 2001.....Which Call Is Worse?

What´s a year without a "brilliant" call ( even more important the rationale behind the call ) from Abby Josef Cohen.....Just in time after a 30% plus (technical ) rally in the major indices worlwide.....In the past especially the calls from permabull Cohen were close to near and often long term market tops...... To my knowledge one of the better "contrary" indicators......

Was wäre ein Börsenjahr ohne Weisheiten von Abby Joseph Cohen.....Man beachte das brilliante Timing.... Rechtzeitig nachdem alle bedeutenden Indizes 30% und mehr gewonnen ( technisch bedingt ) haben..... Ein prima Kontraindikator. Die "Prognosen" vom Permabullen Cohen haben in der Vergangenheit zeitlich oft ein längfristiges Markthoch markiert...... Besonders wenn die Begründung für die avisierten Kursziele schon fast tragischkomischen Charakter haben bzw. man befürchten das die Schweinegrippe auch Wall Street erreicht hat...

Call 2001 just bevor the collapse:

bigger/größer

Hat tip Wall Street Follies

Call 2009 S&P 500 at 880:

Goldman Sachs’s Cohen Says S&P 500 May Surge to 1,050

May 1 (Bloomberg) -- The Standard & Poor’s 500 Index may jump 20 percent to 1,050 over the next six to 12 months as investors buy stocks trading at low valuations, said Abby Joseph Cohen, Goldman Sachs Group Inc.’s senior investment strategist.

> Low valuations....? "Fair value based on recession earnings" ( Quote Cohen ) ? She is probably using the following model showing the "high" quality of earnings ( backing out large parts of costs doing business like write downs, restructoring charges etc / see also the update at the end of the posting) or she is the only one thinking the Fed Model ( see "Fed Model" Knowing What Ain't True ) is usefull.....

> Niedrige Bewertungen.....? "Faire Bewertung die auf rezessionsgestählten Ergebnisprognosen basieren" ( Zitat Cohen )? Mag ja sein das sie Ihre Bewertungsmodelle auf der nachfolgenden Rechnungsmodellen basiert die an Kreativität ( "Sonderfaktoren wie Abschreibungen, Restrulturierungskosten usw werden ausgeklammert ) kaum zu überbieten sind ( siehe auch Update am Ende ). Denkbar auch das Sie als einzige dem Fed Modell ( siehe "Fed Model" Knowing What Ain't True ) glauben schenkt...........


“You could see the market sustain at these levels,” Cohen, 57, said in a Bloomberg Radio interview. “We’re going to set a new trading range much higher than the trading range in February and March.”

Cohen was replaced as Goldman Sachs’s chief forecaster for the U.S. stock market a year ago. She had been the second-most bullish Wall Street strategist at the start of 2008, a year when the S&P 500 tumbled 38 percent to 903.25 for the steepest annual loss in seven decades. Cohen predicted in December 2007 that the index would end last year at 1,675. David Kostin took her job.

At least i think her 2009/2010 call will be closer to the target than her over 40 percent miss for the 2008 December estimate...... :-)

Immerhin wird sie wohl Ihre 40% Zielverfehlung Ihrer letztjährigen Prognose verbessern können...... :-)

UPDATE:

This just in from David Rosenberg via Zero Hedge . I highly recommend to read the entire link. Compare this to the call from Cohen.....

Den nachfolgenden Link via Zero Hedge empfehle ich allen die das Kontrastprogramm zu Cohen lesen wollen. Eine realistische und fundierte Marteinschätzung von einem der auch die bisherigen Probleme vorhergesen hat ( David Rosenberg ).

The market, as a whole, cannot be considered cheap

In the meantime, earnings forecasts are being trimmed steadily for the balance of the year. In fact, forward P/E multiple of 15x operating and 30x on reported EPS are not that compelling. So, we do not have a strong valuation argument. We do not have a strong earnings argument.

Compare the following chart with the former S$P500 1675 target from Cohen......

Vergleicht den nachfolgenden Chart mit dem vorherigen Kursziel ( S&P 500 1675 ) von Cohen.....

via Chart Of The Day
While the stock market is up sharply since early March, the economy as well as corporate earnings continue to suffer. Today's chart helps provide some perspective as to the magnitude of the current economic decline. Today's chart illustrates that 12-month, as-reported S&P 500 earnings have declined over 90% over the past 20 months (with over 90% of S&P 500 companies having reported for Q1 2009), making this by far the largest decline on record (the data goes back to 1936). In fact, real earnings have dropped to a record low and if current estimates hold, Q3 2009 will see the first 12-month period during which S&P 500 earnings are negative.

Sunday, April 27, 2008

Earnings Risk / Hussman

This should come as no surprise..... Here are more examples of how smart "Wall Street Finest" have acted in the past.... Keep this in mind when you here "the market is cheap based on our 2009 earnings estimates".....

Sollte keinen wirklich überraschen..... Hier ein paar weitere Beispiele für den Scharfsinn von "Wall Street Finest" . Kann nicht schaden sich diese Prognosesicherheit in sGedächnis zu rufen wenn es wie so oft zu hören mal wieder heißt " Auf Basis unserer Gewinnschätziungen für 2009 sind Aktien billig"......


Earnings Risk / Hussman
On the earnings front, we continue to expect significant pressure on profit margins and resulting cost-cutting pressures to weigh on employment. Given that Wall Street analysts continue to build a major second half recovery into earnings projections, it is important to ask whether those earnings estimates are likely to be reliable.

Since analyst estimates of earnings are almost invariably higher than current operating earnings, and earnings tend to grow over time, it is easy to assume that analyst estimates usefully “lead” earnings. Unfortunately, this isn't true, particularly at turning points when earnings trends are slowing or improving.
In q4 more than 1800 Analystst had predicted a 7.9 percent increase in earnings. In reality the earnings crashed 22.6 percent. This large divergence marked a new record.....
Was im vierten Quartal 2007 passiert ist, war kein Ruhmesblatt für die Branche. Denn mit ihren Prognosen für die amerikanischen Unternehmen in diesem Berichtszeitraum haben die 1800 Analysten der Wall Street um mehr als 30 Prozentpunkte zu hoch gegriffen. Konkret wurde mit Gewinnsteigerungen von 7,9 Prozent gerechnet, letztlich sanken sie aber um 22,6 Prozent. Damit lagen sie so weit daneben wie noch nie.
James Montier at Societe Generale demonstrates this nicely by subtracting the upward linear trend from both operating earnings and analyst estimates. What remains are the deviations of earnings and estimates from their long-term trends.

If analyst estimates anticipate subsequent earnings, the “forecasts” line (black) should turn upward or downward before the “earnings” line (red) turns. But as James notes, “The chart makes it transparently obvious that analysts lag reality. They only change their minds when there is irrefutable proof they were wrong, and then only change their minds very slowly.”

Moreover, as Tim Hayes of Ned Davis Research points out, the difference between GAAP earnings (based on generally accepted accounting principles) and operating earnings “has reached its second widest level on record. What all this means is that the greater the focus on operating earnings, and especially forecasted operating earnings, the greater the vulnerability to disappointment on the GAAP earnings reality. And it supports giving the cyclical bear market downtrend the benefit of the doubt.”
AddThis Feed Button