Showing posts with label wall street finest. Show all posts

Thursday, August 5, 2010

China "Bubble" ( Bursting ) Update & Newest Spin "Excluding Tier 1 Cities Everything Is Fine......"

Not only the cracks regarding the Three Gorges Dam are getting more and more obvious on a daily basis...... You can read my earlier takes on China here

Nicht nur der Drei Schluchten Damm zeigt erste Risse...... Mehr von mir zum Thema China gibt es hier

Andy Xie via NC

How many flats in China are sitting empty? The media recently floated a story — denied by power companiesthat 64.5 million urban electricity meters registered zero consumption over a recent, six-month period. That led to a theory that China has enough empty apartments to house 200 million people….

What especially distinguishes China’s property bubble…is an unprecedented amount of living space. This huge stock of empty flats equals the nation’s quantity bubble.

Although the government doesn’t publish vacancy data, I think the vacancy rate for the nation’s private, commercial housing stock is between 25% and 30%. That’s at least double what’s required in a normal market. The gap between what’s needed and what’s available can be viewed as speculative inventory. The value of this inventory held by speculators is probably around 15% of GDP.

It’s being kept on ice, just as copper and other commodities are hoarded in anticipation of rising prices…

Looking at the clip & the TIME photo gallery Ordos, China: A Modern Ghost Town the very high number looks less "hyperbolic"....

Wenn man sich den Clip & die Photoserie von TIME Ordos, China: A Modern Ghost Town ansieht erscheint die extrem hohe Zahl weniger "übertrieben"....


China Tests Said to Check Risk of Cash Crunch Among Developers Bloomberg
China’s stress tests of banks will assess the risk that a possible slump in property prices may strain developers’ finances and cause homebuyers to default, a person with knowledge of the matter said.

The banking regulator told lenders to include worst-case scenarios of prices dropping 50 percent to 60 percent in cities where they have risen excessively

Banks were also told to stress test loans to industries including steel, cement, construction materials and home appliances that are related to housing, the person said

Previous stress tests carried out in the past year assumed home-price declines of as much as 30 percent.
I´ll bet that every (big) bank will pass.....;-) I have to repeat myself Another Reason Why The Chinese Banking Financial Strength Rating Is Just Beating Iceland & Kyrgyzstan..... & that despite almost $60 billion in recent capital increases from the big banks the term "Drop in the bucket" fits perfectly....

Bin mir sicher das keine einzige (wichtige) Bank durchfallen wird.... Verweise hier auf Another Reason Why The Chinese Banking Financial Strength Rating Is Just Beating Iceland & Kyrgyzstan..... Denke das trotz der fast 60 Mrd $ an Kapitalerhöhungen der Banken in jüngster Zeit die Bezeichnung "Tropfen auf den heissen Stein" dürfte passen....

Cracks in the Chinese bubble? FT Alphaville
....the rule of law remains weak in Chinese property overall — 24 out of 30 developers surveyed said they knew of companies that had illegally taken out bank loans to buy land.
Land ministry finds 1,457 unused plots China Daily via FT Alphaville
China's Ministry of Land and Resources has found 1,457 unused plots of land nationwide and given a list of what companies hold rights to these plots to the China Banking Regulatory Commission, the China Securities Journal reported today, citing a person familiar with the situation.

The banking regulator will use the list to conduct a risk assessment, the Beijing-based newspaper reported. About 80 percent of the unused plots may be repossessed by the government, according to the report.

It looks like the latest spin attempt to keep the "story" intact comes along the line "excluding Tier 1 cities everything is fine "..... Where have i heard this bevore.... ? ;-)....

Sieht ganz so aus als wenn die nächste Sau die durchs Dorf getrieben wird um zumindest den Anschein zu erwecken das noch nicht alles verloren ist die Überschrift trägt "Abseits der Tier 1 Städte ist der Immobilienmarkt noch intakt"....... Wo habe ich das bloß vorher schon einmal gehört.... ? ;-)

Standart Chartered FT Alphaville

while the focus is on Tier 1 cities, there is a good chance that they do not represent the national trend.

There are, after all, hundreds of other cities around China that are busy growing, and in which people might be still busy building and selling apartments.

Sales have fallen in Tier 2 and Tier 3 cities too, but not by as much as in Tier 1 cities, as Chart 2 shows [above]. (In our chart, we have used data from 10 cities: Tianjin, Chongqing, Chengdu, Hefei, Wuhan, Changsha, Dalian, Nanjing, Suzhou and Changchun).

Indeed, in some cities – Hangzhou in Zhejiang province, for instance – we have actually seen prices push up a little since April.

This was a Tier 1 bubble and it looks to have been pricked without killing the Tier 2 and Tier 3 markets

China Real Estate Survey

H/T ZH

At least they acknowledge that Tier 1 is a bubble.....Take a secound look at the volume stat on page 2...... Crashing is defintely not an overstatement....UPDATE:StanChart: Chinese property correction imminent

Immerhin wird richtigerweise der Tier1 Immobilienmarkt als Bubble identifiziert.....Denke die Volumenangabe auf Seite 2 ist besonders "beeindruckend"..... Der Begriff "Crash" ist sicher nicht als übertrieben einzustufen....UPDATE: StanChart: Chinese property correction imminent

UPDATE:

Following the great (stock market) leader — China FT Alphaville

As equity markets should act as a leading indicator of broader economic growth trends, it seems, therefore, that the Chinese equity market has recently become ‘the leading indicator of the leading indicators’. Given that the local Shanghai Composite index and MSCI China have both rebounded by 13-15% from their recent lows and our China strategist, Minggao Shen, has just turned more bullish on the market1, these events are a positive mix for global emerging markets as a whole. This is, therefore, a good time to consider the Chinese market’s role as a signaling mechanism for GEMs as a whole.

China is now a very large economy (the second biggest in the world, accounting for an estimated 9% of global GDP in 2010) and a big stock market (the ninth biggest in the world).

The Chinese economy is also expected to account for as much as 23%10 of global growth (i.e., the rise in global GDP) in 2010, a share that is higher at present due to the weakness of developed economies . . .

China not only now accounts for a significant proportion of global growth in a but it is, by far, the biggest consumer of commodities. Our commodities analyst, Alan Heap11, reports that China currently accounts for the consumption of around 40% of several major metals including copper, nickel, and aluminum . . .

Oh boy.... Wall Street Finest / Shanghai strikes again.... Too bad that he didn´t mention that one reason for the rise in the stock market is probably the stalling real estate market.... With negative real interest rates Chinese have besides GOLD almost no place to put their money to work..... If my view on real estate is correct all his bullish arguments would be turned upside down......

Mal wieder perfektes ( Experten ) Timing..... Wäre nett gewesen wenn zumindest in einem Nebensatz erwähnt worden wäre das einer der Haupttreiber für den Geldfluss in die Aktienmärkte der rapide abkühlenden Immobiliensektor ist....Da die Chinesen mit negativen Realzinsen leben müssen und Abseits von GOLD nur der Aktienmarkt als Alternative übrig bleibt verwundert die gesehene "Stärke" nicht....Sollte ich mit meiner Meinung zum Immobilienmarkt in China auch nur im Ansatz Recht behalten drehen sich die o.a. "bullischen" Argumente über Nacht ins Gegenteil....

Monday, July 19, 2010

Stresstesting The DAX......

A follow up on last years Number Of The Day " Goodwill On Top 133 Listed German Companies Balance Sheets....". Considering that German companies are usually rated as "solid", "conservative" & "prudent" the data is even more "stunning"....

Nettes Update zu Number Of The Day " Goodwill On Top 133 Listed German Companies Balance Sheets...." aus dem Vorjahr. Wenn man bedenkt das besonders Deutsche Firmen weltweit als überwiegend "solide", "konservativ" & "vorsichtig" gelten, finde ich die Daten umso "bemerkenswerter"....


Dax im Stresstest Wirtschaftswoche
The 30 companies listed in the DAX accumulated $ 265 Billion in goodwill. The number has risen almost € 30 billion over the past 2 years.

The total amount equals 5 times the annual earnings from all DAX members.....

180,6 Milliarden Euro an Firmenwerten, 30 Milliarden mehr als noch vor zwei Jahren, schleppen die 30 Dax-Unternehmen heute mit sich herum.

Das entspricht rund fünf Jahresgewinnen aller Dax-Firmen
.
Despite that large part of the M&A was done during the boom years & the deepest recession in decades so far virtually no write downs have occurred....Ignoring "Mark to Market" is not only popular when it comes to the banking industry....;-) I doubt that the worldwide data looks much more favourably..... Keep this at least in mind when it´s again time for another episode of "Wall Street Finest : It´s Always A Good Time To Buy, Buy, Buy....."

Trotz der tiefsten Rezession seit Jahrzehnten sowie der Tatsache das ein Großteil der Übernahmen in den Boomjahren vollzigen worden sind de facto kaum Abschreibungen......Sieht so aus als wenn das Ausblenden von "Mark to Market" nicht nur bei den Banken äußerst beliebt ist.....;-)Tippe mal darauf das die Daten weltweit nicht wesentlich besser aussehen.....Kann nicht schaden sich das zumindest im Hinterkopf zu merken wenn es wieder heisst "Wall Street Finest : It´s Always A Good Time To Buy, Buy, Buy....."

Sunday, July 11, 2010

Hussman & Hester vs Wall Street Finest.......

Once more brilliant "Anti Spin" & almost a rant from the usually polite Hussman.....Spot on with my take Of Course It Is Still A Good Time To Buy, Buy, Buy..... when it comes to Wall Street Finest.....
There maybe are legitimate reasons to buy stocks, but a favourable opinion from "Wall Street Finest" should definitely not play any role among your screening process .... Except you use them as a "contrary indicator".... ;-)
Einmal mehr deutliche Worte vom ansonsten doch recht zurückhaltenden Hussman....Eine erstklassige Ergänzung zu meinem früheren Posting Of Course It Is Still A Good Time To Buy, Buy, Buy.....
Grundsätzlich mag es ja durchaus gute Gründe die für Aktien sprechen geben, man sollte aber sicherstellen das die Einschätzungen der "Experten" beim Auswahlprozess keinerlei Rolle spielen....Es sei denn man nutzt sie als Kontraindikator.... ;-)

H/T Randy Glasbergen Collection

Misallocating resources John Hussman
On a valuation basis, the S&P 500 remains about 40% above historical norms on the basis of normalized earnings. The disparity between our valuation assessment and the putative undervaluation being touted by Wall Street analysts is so great that a few remarks are in order. First, virtually every assessment that "stocks are cheap" here is based on the ratio of the S&P 500 to year-ahead operating earnings estimates, and often comes with a comparison of the resulting "earnings yield" with the depressed 10-year Treasury yield. What's fascinating about this is that this is the same basis on which analysts deemed stocks to be about 40% undervalued just prior to the 2007 top, following which the market plunged by more than half.

To properly understand the price-to-forward operating earnings ratio, you have to recognize that operating earnings exclude a whole host of charges - what some observers correctly call "recurring non-recurring" charges. These include large and often quite regular losses that the companies deem, often on the thinnest basis, to be detached from their core business - even if the losses are directly related to their core business.
More on this topic in "Reported Earnings vs Operating Earnings"

Mehr zum Thema in "Reported Earnings vs Operating Earnings"

When you hear analysts say that the historical average P/E ratio is about 15, you have to recognize that this is the normal P/E based on trailing 12-month earnings after subtracting all writeoffs and other charges. Forward operating earnings are invariably much higher, and it turns out that the comparable historical norm, as I discuss in that 2007 piece, is only about 12. If you exclude the late 1990's bubble valuations, you get a historical norm closer to 11.5. The 1982 and 1974 market lows occurred at about 6 times estimated forward operating earnings

A final observation is crucial. Current forward operating earnings estimates assume profit margins for the S&P 500 companies that are nearly 50% above their long-term historical norms. While we did observe such profit margins for a brief shining moment in 2007, profit margins are extraordinarily cyclical. Investors will walk themselves over a cliff if they price stocks as if profit margins, going forward, will be dramatically and sustainably higher than U.S. companies achieved in all of market history.

They also ignore the large percentage of reported earnings that are actually quietly distributed to corporate insiders through the issuance of stock and options.

They blindly accept that "share repurchases" are somehow a pleasant distribution of earnings, whereas the majority of share repurchases are actually made by companies to do nothing more than offset the dilution from stock shares and options granted to insiders.

A good question to ask in the years ahead, immediately after profits are reported, is "how much of this figure is actually delivered to shareholders?" If you've been attentive over the past decade, the answer turns out to be much closer to the dividend yield than to the operating earnings yield that companies have reported.

For a moment, at least, it is good to be a corporate insider, particularly at major financial companies.

First, you get to report productivity gains and "operating profits" - not by making smart investments in productive assets, but instead by writing up debt thanks to Treasury intervention, by misstating your balance sheet thanks to FASB changes last year, and at industrial firms, by cutting the number of workers per unit of capital.

Next, you quietly write off large losses on bad investments and unrecoverable loans as "extraordinary expenses," to which investors pay no notice.

And to add insult to injury, you deliver a significant portion of the remaining profits to yourself as "incentive compensation," followed by buybacks of stock to offset the dilution, which investors actually cheer because they don't realize they've been taken for suckers.

Wall Street Earnings Expectations Ignore Economic Divergences Bill Hester / Hussman Funds

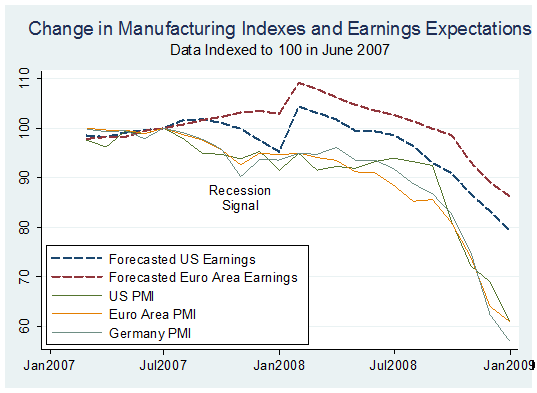
The graph below attempts to contrast the erosion in the global PMI indexes against the rising optimism of stock analysts.

Six series of data are plotted: the changes in earnings expected for the companies in the S&P 500 and the Euro Stoxx Index, and four PMI indexes for the US, the Euro area, Germany, and China. Each of the series is indexed to 100 in April, the month where most of the PMI data peaked.

Now take a look at the Chart showing the period between 2007 and 2008 using the same indices.... I highly recommend to read the entire links.... There is much more.....

Hier zum Vergleich der identische Chart für die Zeit von 2007 bis 2008...... Empfehle die kompletten Links zu lesen... Wie üblich findet man dort noch deutlich mehr "Anti Spin"......

UPDATE:

RARE INTERVIEW WITH JOHN HUSSMAN: WHY HE IS BEARISH RIGHT NOW PragCap

Stocks Expected To See 12% Increase In Revenues In Q2, 41% Increase In EPS, And A Summary Outlook From Rosenberg ZH

As for all of 2010, the consensus is at $82 operating EPS, and for a new record to be reached in 2011, at $96 — breaking the record of $88 three years ago. Good luck in seeing a further 30% increase in profits with nominal GDP rising at a 3.0-4.0% annual rate at best in the next six quarters and at a time when margins are already back to cycle peaks.
For the full John Hussman archive visit the blogroll.....

Für eine komplette Auflistung der gesammelten Werke von Joghn Hussman bitte Blogroll beachten.....

Saturday, July 3, 2010

Dilbert vs Wall Sreet Finest 1:0.......

To understand the headline you should read Of Course It Is Still A Good Time To Buy, Buy, Buy..... Almost unbelievable that this link is just one month old......

Um die Überschrift zu verstehen empfehle ich Of Course It Is Still A Good Time To Buy, Buy, Buy..... zu lesen.... Kaum zu glauben das dieser Link erst einen Monat auf dem Buckel hat...

Dilbert.com

H/T Dilbert

UPDATE:

Looks like the guy mentioned in the first link named James Altucher doesn´t even have a rolling forecast ( at least not downwords ) .... He is more than ever in the S&P 500 will hit 1500 camp...Compare the clip with this one from June 2008 just before the big crash Forget Your Fears: 'Everything Is Cheap,' James Altucher Says..."BROKEN RECORD" comes to mind...No wonder even the usually polite Mish has called him "Completely Whacko".... This kind of "expertise" has "earned" him his own Blog label/tag.....I hope his remaining clients use him only as a contrary indicator..... Thank god he is bearish on GOLD ( Quote "It's just a rock.." ).... UPDATE: James Altucher Argues That The Fed Should Intervene Massively In The S&P Futures Market

Nett zu sehen das einer der Typen aus dem ersten Link Namens Altucher zumindest wenn es gen Süden geht nicht einmal im Ansatz einen "rolling forecast" im Repertoire hat... Er ist mehr denn je überzeugt das sein S&P Ziel von 1500 jetzt erst Recht erreicht wird.... Vegleicht den Clip mit dem folgenden vom Juni 2008 kurz brvor sich die Dow & Co halbiert haben Forget Your Fears: 'Everything Is Cheap,' James Altucher Says.. .Damit hat er sich jetz sein eigenes Blog Label/Tag verdient....Bleibt zu hoffen das seine verbliebenden Kunden ihn lediglich als Kontraindikator nutzen....Glücklicherweise ist er in Sachen GOLD weniger positiv...Zitat :"It's just a rock.." UPDATE: James Altucher Argues That The Fed Should Intervene Massively In The S&P Futures Market

Friday, June 18, 2010

"Wall Street Finest : It´s Always A Good Time To Buy, Buy, Buy....." BP Edition.....

Even as i have to admit that the "BP SPILL DRAMA" is a very complicated to judge it is nevertheless a perfect fit to my earlier post Wall Street Finest.... Of Course It´s A Good Time To Buy, Buy, Buy..... and a nice confirmation for what i´ve said in the past ....
"There maybe are legitimate reasons to buy stocks, but a favourable opinion from "Wall Street Finest" should definitely not play any role in your screening process .... Except you use them as a "contrary indicator".... ;-) "
Selbst wenn ich zugeben muß das der BP GAU schwer einzuschätzen ist, passt es wie die Faust aufs Auge zu Wall Street Finest.... Of Course It´s A Good Time To Buy, Buy, Buy..... und ist nebenbei die Bestätigung zu dem was ich bereits seit langem zum Thema "Experten" zu sagen habe....
"Grundsätzlich mag es ja durchaus gute Gründe die für Aktien sprechen geben, man sollte aber sicherstellen das die Einschätzungen der "Experten" beim Auswahlprozess keinerlei Rolle spielen....Es sei denn man nutzt sie als Kontraindikator.... ;-)"

Special Report: Amid the Gulf crisis, Wall St touted BP stock Reuters

As early word of BP's Deepwater Horizon blowout began spreading, investors panicked. After closing above $60 before the April 20 disaster, the energy giant's shares plunged almost 20 percent in New York, to below $50, in just two weeks.

It is not hard to understand why. Even then, the out-of-control oil spill in the midst of rich fishing grounds and nearby resort beaches raised the specter of horrific damages and untold potential liabilities.

Yet, nearly to a person, the dozens of securities analysts who followed the British oil giant were unfazed. As BP shares continued to drop, most were screaming the same message: buy, baby, buy.

Credit Suisse, which had a "buy" rating on the stock at the time, did not even mention the accident in an April 28 report. The firm upgraded earnings estimates after BP reported strong quarterly results the day before.

A day later, with BP's shares then down 11 percent, Citigroup's Mark Fletcher weighed in. He argued that the decline was "disproportionate to the likely costs to the company, even assuming damages can be claimed." In the same report, he estimated BP's total share of the cleanup at just $450 million -- today, conservative guesses put the figure at $10 billion to $20 billion.

Around that time, Morgan Stanley was among the chorus citing the strong rebound of Exxon (XOM.N) shares after the 1989 Valdez tanker spill in Prince William Sound, Alaska, as a reason to be bullish. "We think the sell-off presents an attractive buying opportunity for investors with medium-term investment horizons," the firm wrote.

All told, 27 of 34 analysts tracked by Thomson Reuters rated the stock "buy" or "outperform" as recently as May 11. The other seven rated the shares "hold." There was not a single rating of "sell" or "underperform" among those tracked.

And then there was the exuberant television host Jim Cramer, who insisted that Bear Stearns was fine just days before the company's stock crashed. On May 10, he told viewers of his "Mad Money" (Cramer: "The Dividend Is Safe, Way Overdone On The Downside" / Stock just under $ 50 & Cramer:Gulf Spill Won’t Break BP / Stock above $ 50 ) show on CNBC that he was purchasing shares of BP for his charitable trust at just under $50. "If you get any good news at all, you're at the bottom," he said. "I'd like to buy it.

BP has at least managed to outperform his May 10th "Housing Shortage Top Pick" SPF... I doubt that he is still refering to his Housing Shortgage Play Version 1.0 July 2008 and has meanwhile switched to version 2.0 or 3.0....To be continued.....UPDATE: Watch his comments after the entire group has tumbled close to 30% & his top pick SPF worst.... To call him a revisionist is an understatement.... Couldn´t resist.....

Immerhin hat BP es geschafft besser als sein anderer Favorit SPF abzuschneiden....Nach seinen letzten Kommentaren im Angesicht einen 30% Crashes im Homebuildingsektor sowie einer Halbierung seines Favoriten SPF muß man schon sagen das der CHUZPAH mehr als treffend ist....


If he did, he didn't make out so well. As estimates of the spill grew -- and grew and grew -- and efforts to cap it failed, BP's stock sunk ever lower. It didn't hit bottom for another month, the New York-traded ADRs touching $29 in midday trading on June 9, down 52 percent from just before the Deepwater Horizon disaster. That's approaching $100 billion in shareholder wealth that has been destroyed.

GROUP THINK

Others say the failure of even one analyst at a major firm to grasp the potential risks and advise clients to dump the stock reflects the profession's overall group-think tendencies. "For sell-side analysts, the incentive is to remain toward the center of the pack. If they are going to be wrong, they have got to be in good company," said Michael MacPhee, at investment manager Baillie Gifford.

As the shares headed toward almost half their pre-disaster level, most analysts issued more cautious notes, with Goldman, Natixis, S&P equity research and Charles Stanley, cutting their ratings to neutral or hold from buy.

By June 16, BP was rated a buy by 16 analysts, outperform by eight, a hold by another 8 with only one sell, according to data on Reuters Knowledge. That was the date, of course, when BP agreed to fund a $20 billion escrow account and suspend its dividends for the year.

With the price around half what it was before the spill, analysts might have a stronger argument that BP was a buy in mid-June, though that will be of little comfort to anybody who followed the advice to buy a month ago.

H/T Reformed Broker

Bloomberg

The split over BP between U.K. and U.S. investors extends to analysts. The U.K. stock has 26 “buy” recommendations, while 12 analysts recommend holding the stock and two say to sell. In contrast, almost as many U.S. analysts advise against purchasing the stock as buying it. The ADRs have seven “buy” recommendations, five “holds” and one “sell.”

And when a guy like Chanos is shorting Exxon widely viewed as the goldstandart in the industry you have to wonder even more....

Wenn ein Typ wie Chanos momentan aber selbst den am meist angesehenen Titel im Sektor Exxon shortet ist das zumindest mehr als eine Randnotitz wert.....

Watch the percentage of sell ratings for S&P 500 companies flatlining even in the deepest recession since 1930........

Man beachte die rote Linie der Verkaufsempfehlungen für die 500 Unternehmen im S&P die selbst während der tiefsten Rezession seit 1930 "stabil" geblieben ist......

BP Oil Spill: Brief History of The Incredible Rising Cost Estimate WSJ Marketbeat

BofA Merrill, April 28 — “To put it in context, the Valdez clean-up cost reportedly reached [around] U.S. $3 billion and we expect the cost to BP to be lower at this point.”

BofA Merrill, April 30 — “If we assume the clean-up takes 6 months and include relief wells costs, total costs would be in the U.S. $2 billion range (U.S. $100 million per well + 180 days at $10 million/day). Even assuming additional civil damages similar to Exxon Valdez of US$2.5 [billion] awarded against [Exxon Mobil] in 2009, BP’s net costs for Macondo would approach [$3 billion] – just over half [first quarter 2010] earnings. While the market may not be willing to assume such a scenario, given ongoing uncertainty, it, nevertheless, underscores that the hit on BP’s shares looks overdone.”

BofA Merrill, May 28 — “The US Geological Survey (USGS) has independently estimated that the flow rate at Macondo is in the 12-19kb/d range. Whilst this is clearly larger than the previous [5,000 barrels a day range] estimate, it is inline with the flowrates of typical wells in the area as we had indicated (see BP: Making tangible progress 21-May). We note that this new information makes no difference to our worst case liability estimate of U.S. $10 [billion] – based on the recently proposed liability limit.”

BofA Merrill, June 10 — “Given the uncertainties presented by the spill (our base case cost est. is $28 [billion] but the worst case scenario cannot be adequately quantified.”

To be continued.....Check out the link for more stunning quotes.... Let´s all hope we won´t see an updated "Hurricane Edition".....

Fortsetzung folgt.......Mehr von den "Experten" gibt es hier.... Daumen drücken das wir um eine ähnliche Auflistung im Zusammenhang mit der "Hurricane Saison" herumkommen.....

Tuesday, June 1, 2010

Tony Dwyer Is Not Alone..........Of Course It Is Still A Good Time To Buy, Buy, Buy.....

What a "surprise"......Keep the following stats in mind when the daily spin "stocks are cheap on forward pe´s" is hitting the MSM... If you want to hear the "rationale" for a 2000 S&P target in 2013 visit Tony Dwyer & his "brilliant playbook" UPDATE: A guy named Altucher is almost as good It's Not a 'V', It's Even Better, Look for New Highs by 2012 .... There maybe are legitimate reasons to buy stocks, but a favourable opinion from "Wall Street Finest" should definitely not play any role among your screening process .... Except you use them as a "contrary indicator".... ;-)

Welch "Überraschung"......Behaltet die nachfolgenden Daten im Hinterkopf wenn es wie tagtäglich in den Medien und auch der Fachpresse gebehtsmühlenartig wieder heißt "das Aktien auf Bewertung der 2011er Gewinne günstig sind"..... Ein eindrucksvolles "Schauspiel" in dieser Disziplin bietet Tony Dwyer mitsamt seinem "brillianten Playbook" für sein 2000 S&P Ziel im Jahr 2013 UPDATE: Dieser Typ ist mindestens ebenbürtig It's Not a 'V', It's Even Better, Look for New Highs by 2012..... Grundsätzlich mag es ja durchaus gute Gründe die für Aktien sprechen geben, man sollte aber sicherstellen das die Einschätzungen der "Experten" beim Auswahlprozess keinerlei Rolle spielen....Es sei denn man nutzt sie als Kontraindikator.... ;-)


Bespoke
Bloomberg surveys sell-side Wall Street strategists on a weekly basis for their year-end S&P 500 price targets. At the start of 2010, the average year-end S&P 500 price target was 1,225, which would have been a gain of just about 10%. As markets moved higher in the first quarter, strategists upped their year-end targets, and the current average target stands at 1,268. (In the table below, green shaded price targets are ones that have been increased so far this year. No strategists have lowered their targets since the start of the year.) A target of 1,268 translates into a gain of 13.68% for the year and 16.48% from current S&P 500 levels.

There are no strategists with year-end targets that are lower than the index's current levels.
Analysts Projecting 27% Gain in S&P 500 Defy El-Erian Bloomberg

Combined price estimates from more than 2,000 forecasters tracked by Bloomberg show the S&P 500 will rise 27 percent in the next year, the fastest projected rate since February 2009, data compiled by Bloomberg show.

The rally above 1,350 will be led by industries most tied to the economy, according to analysts who boosted individual share projections by an average of 0.9 percent in May, the 14th straight monthly increase.

Should analysts’ forecasts for a 27 percent gain in the S&P 500 come true, the gauge would climb to 1,360 by next May, the highest level since June 2008.

The real story here are not the S&P 500 targets from the "strategist" but that they have managed to increase the target since the beginning of the year.... Despite events like the Flash Crash ( "Cancel All Orders, Cancel All Orders....." ), "minor headwinds" when it comes to Sovereign Debt,China , for US companies an unfavourable strong $ , impact from the "Oil Spill" on drillers & still insolvent Banks it´s fair to say that ROSE COLORED GLASSES are still a must have item among way too many among "Wall Street Finest"... ;-)

Die eigentliche Botschaft sind nicht die angegebenen Kursziele, sondern vielmehr die Tatsache das diese trotz einiger unschöner Ereignisse die vermehrt seit Jahresbeginn aufgetaucht sind wie dem sog. Flash Crash ( "Cancel All Orders, Cancel All Orders....." ), "minimalen" Problemen wenn es um Sovereign Debt,China den für US Firmen ungünstigen "starken $" , seit dem BP GAU die Probleme der Ölförderer & die immer noch bemerkenswert schwachen Banken geht, munter fleissig angehoben worden sind..... Denke es ist keine Übertreibung zu sagen das eine ROSAROTE BRILLE unter etlichen von "Wall Street Finest" noch immer zur "Standartausrüstung" gehört.... ;-)

I´ll let "Mr. Anti Spin" David Rosenberg du some further "bashing"..... Do yourself a favour & subscribe to his free DAILY REALITY CHECK... SUPERB!

Überlasse es "Mr. Anti Spin" David Rosenberg noch mehr Wasser in den Wein zu gießen....Empfehle allen sich frei Haus die tägliche Dosis Rosenberg zu genehmigen....

"It’s also fascinating to read the “Ahead of the Tape” column in the WSJ today and to read about the fabulous earnings performance of U.S. companies — a revival built on a weak U.S. dollar, accelerating global growth, fiscal stimulus and a steep yield curve.

Meanwhile, the consensus has just now gone ahead and projected peak earnings for 2011 just as each of these main crutches are reversing course."

AMEN....

McKinsey: Equity Analysts Are Still Too Bullish via Barry

Moreover, analysts have been persistently overoptimistic for the past 25 years, with estimates ranging from 10 to 12 percent a year, compared with actual earnings growth of 6 percent.

Over this time frame, actual earnings growth surpassed forecasts in only two instances, both during the earnings recovery following a recession. On average, analysts’ forecasts have been almost 100 percent too high.”

This chart completes the not so glory picture when is comes to the credibility & reputation from "Wall Street Finest".... If you have the "guts" to read the "rationale" behind Goldmans bullsih call you should read Goldman: "We Raised S&P 500 EPS Estimates Despite Worst May Performance In Almost 50 Years"

Dieser Chart paßt hervorragend ins Bild unm das das wenig glorreiche Bild abrunden....Für alle die die Nerven haben und wissen möchten auf welchen "Modellen" die Schätzungen von Goldman basieren Goldman sollte Goldman: "We Raised S&P 500 EPS Estimates Despite Worst May Performance In Almost 50 Years" lesen....

UPDATE:

Profit-Margin Outlook for U.S. Is ‘Extremely Bad’: Chart of Day Bloomberg

Best Stocks Liked Least by Analysts Missing U.S. Gain Bloomberg

Sunday, May 23, 2010

Most Impressive Sovereign Funding Official 2009 Award Went To Spyros Papanicolaou ( Greece )

You cannot make this up......Very hard to hide a big deal of SCHADENFREUDE when you keep in mind that the awards were determined by a poll of bankers and borrowers .... On the other side it´s too bad that exact these same so called "sophisticated" investors ( not speculators! ) got once again bailed out for their ( ongoing ) very poor judgement.....The following quote from John "Anti Spin" Hussman "Prostituting the fiscal stability of an entire nation for the benefit of bondholders who made bad loans ?"( Hussman is really "upset"..... ) & this must see clip :-)! are unfortunately spot on... Go and read the entire link !

Kein Aprilscherz......Wenn man bedenkt das dieser Preis in einer Abstimmung von Bänkern und Investoren vegeben worden ist kann man sich eine gewisse Portion SCHADENFREUDE einfach nicht verkneifen...... Gleichzeitig wird die Wut darüber, das genau diese Investoren ( nicht Spekulanten! ) trotz Ihres offensichtlich zum wiederholten Male vernebeltem Urteilsvermögen erneut über immer größer werdende Bailouts rausgehauen werden, tagtäglich größer ......Leider handelt es sich beim nachfolgenden Zitat von John "Anti Spin" Hussman "Prostituting the fiscal stability of an entire nation for the benefit of bondholders who made bad loans?" ( Wer den ansonsten sehr besonnenen Hussman kennt kann erahnen das hier einer ziemlich "aufgebracht" ist ...) sowie diesem wunderbar humoristischen Clip :-)! um eine treffende Bestandsaufnahme und um keine Übertreibung......Empfehlen allen den kompletten Link zu lesen !


WSJ

Beware the lessons of history—especially when they involve Greece. The winner of Euroweek's 2010 award for most impressive sovereign funding official richly deserved it: Robert Stheeman, head of the U.K. Debt Management Office, steered through a whopping £185 billion ($268 billion) of gilt sales in the last fiscal year.

But Mr. Stheeman might not want to look too closely at the award's history: Last year's winner was one Spyros Papanicolaou, the former head of Greece's Public Debt Management Agency.

Rough times for GILTS & the POUND ahead.....

Sieht ganz so aus als wenn es für GILTS und das britische Pfund demnächst ruppig werden könnte......

Monday, April 5, 2010

Profit Margins, Margin Debt & Margin Of Error.......

Combine the data points with the excellent When Risk-Return Makes No Sense: How To Deal With An Overvalued Market and it should be clear that Mr. Market is walking on very thin ice now... I must admit that this is my view since September/October......Cannot help but it at least smells a little bit like "Flucht In Sachwerte"... I still think that the risk / reward is far more favourable in GOLD... ;-)

Wenn man die folgenden Daten mit dem extrem lesenswerten When Risk-Return Makes No Sense: How To Deal With An Overvalued Market kombiniert wird klar das man sich momentan auf sehr dünnem Eis bewegt.... Muß gestehen das ich diese Ansicht seit dem September/Oktober vertrete.... So langsam kann man zumindest unterschwellig das Gefühl haben das zumindest in Teilen eine "Flucht In Sachwerte" eingesetzt hat.....Bin mehr denn je überzeugt das in Sachen Chance/Risiko die Aussichten für GOLD weitaus vielversprechender sind.... ;-)

William Hester / Hussman Funds
While earnings growth expectations are steep, sales growth expectations are more modest. Sales-per-share for S&P 500 companies is expected to grow about 5.5 percent this year and about 7 percent next year, according to forecasts. The difference between the growth rates of the top and bottom lines is implies a forecast for sharply rising operating profit margins. The graph below is updated from an earlier piece, and includes forecasts through the end of 2012. It plots the long-term level of S&P operating margins in blue. In red, I've plotted the operating margins currently being forecasted by analysts based on their projections for sales and earnings. Last October, analysts were about half way to pricing in profit margins that matched the record levels of 2007. Now, they are just about there.
David Rosenberg / Gluskin Sheff
As for 2011, the consensus is looking for $97 on S&P 500 operating EPS — we did $95 at the peak of the last cycle when the unemployment rate was at 4.5%, the industry CAPU rate was 81%, private sector credit xpanding at a 16.2% annual rate and nominal GDP at a 4.9% YoY pace.
So the consensus believes that barely two years into the second weakest post-recession recovery in the past six decades that we will actually get back to peak profit levels seems to be a tad outlandish.
Stock Market Rally Explained The Mess That Greenspan Made

Ad in the the Money & Investing section of today’s Wall Street Journal

Factoring in the tight junk spreads right now one must assume that looking at the next chart the "Margin Of Error" is probably "slim"......

Da momentan selbst historisch gesehen recht enge Junk Spreads vorherrschen muß man beim Anblick des nächsten Charts wohl unterstellen das in Sachen "Margin Of Error" wenig "Spielraum" bleibt.....

Investors really ♥ junk. We mean really. FT Alphaville

In most discussions of the high-yield bond market, historical spreads play a major role. But comparing spreads today to those of the past assumes that junk bonds are a constant entity over time. Unfortunately, junk is junkier today, as illustrated by this chart [at left] from last October’s Global Financial Stability Report.

The fraction of CCC or lower-rated bonds approximately doubled from early 2007 to early 2009. And according to a recent report from Fitch, the fraction at the end of 2009 was still 27%.

Debt ranked in the BB category gained 39.1 percent in the past 12 months, underperforming the CCC tier by 66 percentage points, according to Bank of America Merrill Lynch index data.


H/T EconomPicData

The "risk trade" is currently clearly not in the early innings....... Looks like the Mantra Bullish. No Matter What & the "Moon Trade" ( brilliant!) is still alive & kicking.... ;-)

Der sog. "Risikotrade" befindet sich sicher nicht mehr im "Anfangsstadium"..... Sieht so aus als wenn das Motto Bullish. No Matter What sowie Ladies and Gentlemen, We Are Trading On The Moon ( brilliant!) momentan noch immer zu greifen scheint...... ;-)+

UPDATE:

PARTS OF THIS MARKET ARE LOOKING IRRATIONAL PragCap

Why Young People Should Buy Stocks on Margin Time H/T Denninger

We just survived the worst debt-fueled binge since the Roaring '20s. Now two professors at Yale University are suggesting we introduce leverage into a new realm of our lives —our retirement portfolios. TIME's Barbara Kiviat asked economists Ian Ayres and Barry Nalebuff to explain themselves.

You are advocating that people in their 20s and early 30s take all of their retirement savings and buy stocks on margin. Can you explain why that's not as crazy as it sounds?

"It's not as crazy as it sounds because it helps people better diversify risk across time"

Read this twice....

UBS: EQUITY MARKET RISKS APPROACHING EXTREMES PragCap

Irrational Exuberance Is Here: VIX Lowest Since July 2007 As Options Speculation Highest Since Dot Com Days

The VIX has just hit the lowest level since July of 2007 as Sentiment Trader reports that "speculation in the options market has spiked to its highest levels since the spring of 2000."
As i´ve said, not in the early innings.....

Wie gesagt, nicht mehr im Anfangsstadium......

Wednesday, March 10, 2010

Cramer´s Bull Case For Banks..... I Can Smell A Top... ;-)

Oh boy..... After the ( even by his standarts.... ) famous "Housing & Bank Stock Shortage" call from January 2008 ( NO KIDDING > see "Ten Trillion $ Worth Of Good Calls" ) was a little bit "premature" he is predicting a bank stock shortage version 2.0.... Would at least be honest if he mentioned the "ultimate moral hazard trade" & the "Enron-esque characteristics" when it comes to accounting as the two main reasons behind the motives to own banks.. ;-)

Die Euphorie ist zurück........ Nachdem derselbe Typ Januar 2008 leicht "verfrüht" bereits einmal eine "Housing & Bank Stock Shortage" ( siehe "Ten Trillion $ Worth Of Good Calls") proklamiert hat ist es höchtse Zeit für eine Version 2.0.....Wäre zumindest ehrlich gewesen wenn er in seinen 10 Gründen die unbedingt dafür sprechen sofort massiv Bankaktien zu kaufen den "ultimativen Moral Hazard Trade" sowie die kreative Bilanzierung die stark "Enron-esque characteristics" aufweist als die Topgründe aufführen würde.... ;-)


Just for the record here are the two main ETF´s tracking the financial sector.....

Nur um die Daten festzuhalten nachfolgend die beiden relevanten Bank/Finanz EFT´s....

Financial Select Sector ETF) $ 15,47 & KBW Regional Banking (ETF) $ 25,47

Needless to say that both ( along with almost every asset class worldwide ) are trading at 52 week highs & had the longest winning streaks since 1995.....Especially Citigroup seems to be a "real bargain"... ;-)

Überflüssig zu erwähnen das die EFT´s ( wie fast alle anderen Anlageklassen weltweit ) auf Jahreshochs stehen & gerade die längste Gewinnserie seit 1995 hinter sich haben....Besonders Citigroup scheint ein "echtes Schnäppchen" zu sein... ;-)

John Hussman Rips Apart CNBC ZH

In reflecting on why the past 15 years have been so riddled by irresponsible speculation, it is impossible to ignore the rise over that same period of widely-viewed financial programming that is equally riddled with cartoonish content that encourages short-term thinking and speculation (buy-buy-buy! sell-sell-sell! boo-yah!)
"Anti Spin" from Chris Whalen via NC ( MUST READ!!!!)

In fact, the banking system is continuing to sink under bad loans and even worse securities losses. Telling the public that the banks are “fixed” is irresponsible. Unfortunately this false perception is widespread, including among major media such as CNBC and also with a number of my clients in the hedge fund world.
But at least Bubblevision is a very good tool to spot sentiment......

Immerhin muß man Bubblevision lassen das es kaum ein besseres Barometer gibt wenn es darum geht die Stimmungen "einzufangen".....

UPDATE: Unrelated....... Ohne Bezug.... ;-)

Citi: Bove Raises to “Buy”; Citicorp Is New Model for U.S. Banks
He figures Citi is worth about $8.50 in that outlook.
"Wall Street Finest & Lehman June 2008 ZH

Hoenig Says Big Banks Must Either Add $210 Billion In New Capital Or Reduce Total Assets By $3 Trillion; Bank Capital Raises Imminent ZH

Thursday, February 25, 2010

Three Quarters Of All German Exports Going To Europe

Correction: For 2009 the number is 63% ......I´m pretty sure the "experts" have figured this "minor" fact into their as usual conservative "Reported Earnings vs Operating Earnings Formula" for German companies ( and with almost $265 Billion in goodwill on the balance sheets of German listed companies this "magic" technique is more important than ever....) ....... Even while several "German Titans" are tied to global growth ( in my mind not sustainable ) i think it is important to keep the strong dependency on Europe in mind when very soon the same guys will tell us that the weak € will rescue Germany/Europe etc..... UPDATE: Spain’s woes and Germany’s export model could mean double dip Edward Harrison

KORREKTUR: Für 2009 beträgt der Anteil 63%..... Bin mir ziemlich sicher das die "Experten" die extrem starke Abhängigkiet von Europa ( UPDATE : Deutsche Exporteure erleiden herben Rückschlag ) wie gewohnt in Ihre extrem "konservativen" "Reported Earnings vs Operating Earnings Formula" miteinbezogen haben ( und bei schlappen 189 Mrd € in Goodwill die in DAX,MDAX und TECDAX Bilanzen schlummern ist diese "magische Formel" wichtiger denn je.... ) . Selbst wenn einzelne deutsche Firmen überdurchschnittlich vom globalen Wachstum ( welches meiner Meinung nicht nachhaltig ist ) profitieren kann man gespannt sein wie lange es dauert das trotz extremer Euroabhängigkeit der schwache € als Kaufargument "ausgepackt" wird.....Selbstredend von denselben "Experten"..... UPDATE: Spain’s woes and Germany’s export model could mean double dip Edward Harrison

WIESBADEN – As reported by the Federal Statistical Office (Destatis) on the basis of provisional data, 75.0% (EUR 746.6 billion) of all goods exported from Germany in 2008 (to the value of EUR 994.9 billion) went to European countries.

The second largest sales market for German goods was Asia with a share of 11.8% (EUR 117.2 billion), followed by America with a share of 10.2% (EUR 102.0 billion).

Only 2.0% (EUR 19.7 billion) of all German exports were sold to Africa and 0.8% (EUR 7.6 billion) to Australia and Oceania.

Compared to Tony Dwyer with his unique "playbook" the DAX estimates indeed look muted. ;-)

Verglichen mit dem US "Experten"
Tony Dwyer sehen allerdings die Prognosen für den DAX noch moderat aus.....;-)
H/T TGTGT

I just couldn´t resist to post this quote........

Konnte mir einfach nicht verkneifen das nachfolgende Zitat zu posten.......

BofA Merrill Lynch Fund Manager Survey October
"Europe is emerging phoenix-like from the ashes as confidence in its banks boosts overall confidence in European equities," said Gary Baker, head of European equity strategy at BofA Merrill Lynch Global Research.
:-) !

Friday, February 12, 2010

Be Very Afraid Of Tony Dwyer......

Listen to the clip ( his performance starts at the 2 Minute mark ) and you know why.......Make sure you don´t have coffee in your mouth when you hear his conservative S&P 500 target ...... Complacency seems to be still running high among some "experts"......

Warum man sich vor Dwyer in Acht nehmen sollte..... Der Clip ( sein Auftritt startet in Minute 2 ) verdeutlicht das mehr als eindrucksvoll.....Vorsichthalber weise ich darauf hin nach Möglichkeit keinen Kaffee zu trinken wenn er sein konservatives S&P 500 Ziel verkündet ...... Die "Sorglosigkeit" scheint unter einigen von Wall Street Finest" noch immer weit verbreitet zu sein.....


H/T Peter

Collins Stewart Picks U.S. Equity Strategist
Collins Stewart has appointed Anthony Dwyer as managing director and chief equity strategist in the U.S., IM Weekly reports. In the newly-created position in the financial advisory firm, Dwyer will use macro-economic and fundamental, technical and historical analysis to advise the institutional clients.
I assume this footage will haunt him in the future...... ;-)

Kann mir gut vorstellen das Ihn dieser Clip von einige Jahre verfolgen wird.. ;-)

UPDATE:

Spinning The Consumer Confidence Number Collins Stewart via ZH

Sunday, November 29, 2009

Reckless Myopia - Hussman

"Banana Republic", "Disaster", "Reckless", "Unconstitutional Breach" ...... Uh ? When Hussman ( one of the best mangers out there > Performance Hussman 2000-2009 ) is using this kind of words it clearly qualifies for a rant..... Needless to say that i think he is spot on...... Just a few reasons why i´m long term bullish on Gold ( short term it looks a little bit crowded )....Along with Rosenberg, Faber one of my long time favourites......

Wenn ein ansonsten sehr besonnener und überaus erfolgreicher ( siehe Performance Hussman 2000-2009 ) Zeitgenosse wie Hussman zu solch drastischen Worten wie "Bananenrepublik", "Desaster", Verfassungswidrig" usw. greift sollte man aufhorchen..... Und das sind nur einige der gewichtigen Gründe warum ich langfristig bullisch für Gold bin ( kurzfristig sieht es allerdings etwas überhitzt aus ).... Wer meinen Blog etwas länger verfolgt weiß, das ich zu 100% übereinstimme.....

Reckless Myopia

From a long-term perspective, my record is very comfortable. But clearly, I was wrong about the extent to which Wall Street would respond to the ebb-and-flow in the economic data – particularly the obvious and temporary lull in the mortgage reset schedule between March and November 2009 – and drive stocks to the point where they are not only overvalued again, but strikingly dependent on a sustained economic recovery and the achievement and maintenance of record profit margins in the years ahead.

I should have assumed that Wall Street's tendency toward reckless myopia – ingrained over the past decade – would return at the first sign of even temporary stability. The eagerness of investors to chase revailing trends, and their unwillingness to concern themselves with predictable longer-term risks, drove a successive series of speculative advances and crashes during the past decade – the dot-com bubble, the tech bubble, the mortgage bubble, the private-equity bubble, and the commodities bubble. And here we are again.

We face two possible states of the world. One is a world in which our economic problems are largely solved, profits are on the mend, and things will soon be back to normal, except for a lot of unemployed people whose fate is, let's face it, of no concern to Wall Street. The other is a world that has enjoyed a brief intermission prior to a terrific second act in which an even larger share of credit losses will be taken, and in which the range of policy choices will be more restricted because we've already issued more government liabilities than a banana republic, and will steeply debase our currency if we do it again. It is not at all clear that the recent data have removed any uncertainty as to which world we are in.

What I do think is that over the past decade, investors (including people who hold themselves out as investment professionals) have become far more susceptible to reckless myopia than I would have liked to believe. They have become speculators up to the point of disaster.

Frankly, I've come to believe that the markets are no longer reliable or sound discounting mechanisms.

The repeated cycle of bubbles and predictable crashes over the recent decade makes that clear. Rather, investors appear to respond to emerging risks no more than about three months ahead of time.

Worse, far too many analysts and strategists appear to discount the future only in the most pedestrian way, by taking year-ahead earnings estimates at face value, and mindlessly applying some arbitrary and historically inconsistent multiple to them.

Discounting the markets three month ahead of time..... ? This is probably only true when they are sniffing around for the next dose of QE or some kind of bailout, subsidy, stimulus etc ...But to do that you don´t need to be a rocket scientist... Washington & the Fed have a 100 percent track record in bailing out anything.....Unlike in Dubai ....;-) I think here is Hussman way too kind........

Vorwegnehmen ?. Denke das die Vergangenheit bewiesen hat das die Märkte und besonders Wall Street Finest hier keinesfall im Vorwege Probleme kommen sehen.... Die Fähigkeit etwas vorwegzunehmen trifft wohl am ehesten zu, wenn es darum geht den nächsten Bailout usw zu erahnen ( der kommt ja bekanntermaßen bestimmt ).... Hier kommt zwischenzeitlich mal wieder der "alte" höfliche Hussman durch.... ;-)

In part, the market's increasing propensity toward speculation reflects the increasing lack of fiscal and monetary discipline from our leaders. Policy makers who seek quick fixes and could care less about long-term consequences undoubtedly encourage investors to embrace the same value system.

Paul Volcker was the last Fed Chairman to have any sense that discipline and the acceptance of temporary discomfort was good for the nation.

In my estimation, there is still close to an 80% probability (Bayes' Rule) that a second market plunge and economic downturn will unfold during the coming year. This is not certainty, but the evidence that we've observed in the equity market, labor market, and credit markets to-date is simply much more consistent with the recent advance being a component of a more drawn-out and painful deleveraging cycle.

As Gluskin Sheff chief economist David Rosenberg noted last week, “Even if the recession is over, the historical record shows that downturns induced by asset deflation and credit contraction are different than a garden-variety recession induced by Fed tightening and excessive manufacturing inventories since the former typically induce a secular shift in behavior and attitudes towards debt, asset allocation, avings, discretionary spending and homeownership. The latter fades more quickly.


Larger / Vergrößerte Version via VOX EU

> On this topic comes another excellent report ( see Charting The Great World Trade Collapse ) via VOX EU

> Empfehle in diesem Zusammenhang einen Blick auf Charting The Great World Trade Collapse ( ebenfalls von VOX EU ) zu werfen.....

“This is why people didn't figure out that it was the Great Depression until two years after the worst point in the crisis in the 1930s; and why it took decades, not months, quarters or even years, for the complete transition to the next sustainable economic expansion and bull market.

... It is truly mind-numbing that a moment after a temporary surge of trillions of dollars, borrowed and tossed out of a helicopter (though to specific corporations and private beneficiaries), analysts would hail a subsequent improvement in corporate results as evidence of “resilience.”

What matters is sustainability, and unfortunately, it is clear that credit continues to collapse.....

Emphatically, the trillions of dollars spent over the past year were not in the interest of protecting bank depositors or the general public. They went to protect bank bondholders.

Instead of taking appropriate losses on those bonds (which financed reckless mortgage lending), those bonds are happily priced near their face value, for the benefit of private individuals, thanks to an equivalent issuance of U.S. Treasury debt. But that's not enough. Outside of a very narrow set of institutions that are subject to compensation limits, just watch how much of the public's money – which benefitted several major investment banks following a very direct route – gets allocated to Wall Street bonuses in the next few weeks.

AMEN......

UPDATE:

Guest Post: Dividends Are Still Trending Worse Than The Great Depression ZH

Monday, September 21, 2009

Looks Like S&P Equity Anlaysts Are As Competent As Their Debt Analysts.....

This kind of expertise from Wall Street Finest based only on hope of a better bailout deal ( proposed from a major sharholder.... ) sums the market action up..... At least S&P isn´t able to play the Pump & Dump like Goldman & others.... Keep in mind that AIG is one of the Zombie Stocks making up to 20 percent of daily NYSE volume.....

Diese "Expertenmeinung" die einzig und allein auf einem noch besseren Bailoutdeal ( passenderweise vorgeschlagen von einem der Hauptaktionäre ) basiert spiegelt recht schön wider was momentan an den Märkten abgeht.....Immerhin kann man S&P nicht wie z.B. Goldman vorwerfen das altbekannte Pump & Dump zu praktizieren.... Man sollte sich zusärtlich noch ins Gedächnis rufen das AIG eine der Zombie Aktien ist die momentan für knapp 20% des täglichen Handelsvolumens stehen.....


AIG Shares Shoot up on Proposal to Ease Government Loan Terms MarketBeat

AIG jumped roughly 11% today after the powerful House Oversight and Government Reform Committee confirmed receiving a proposal from former CEO Maurice “Hank” Greenberg to restructure the government’s bailout of the insurance giant.

The reports prompted S&P Equity Research to boost AIG to “hold” from “sell.”

We see this news buoying the shares near term,” S&P’s Catherine Seifert wrote in quick squib earlier today. But before you sink the kid’s college fund into AIG shares, keep this in mind:

It’s far from clear that there’s actually any actual equity value in this company.

“We note June 30 tangible common equity was minus $261.66 per share,” Seifert states

Needless to say that according to Yahoo Finance there is no sell rating ( 10 hold ) on AIG.....;-)

Überflüssig zu erwähnen das lt. Yahoo Finance keine einzige Verkaufsempfehlung ( 10 mal Halten ) existiert.....;-)

UPDATE: Traders Seek Fortune in AIG, a Stock Once Left for Dead WSJ

Thursday, August 13, 2009

"Reported Earnings vs Operating Earnings"

I´ll repeat what i have said in my post But Still Better Than Expected....

Thank god that real earnings don´t matter...until they matter..Some still call the market "cheap"...... No problem with the right pro forma ( What are pro forma earnings? ) model/formular.... Havn´t heard the word GAAP for a long time..;-)

Ich wiederhole einfach das was ich in meinem Posting But Still Better Than Expected........ gesagt habe.....

Gottseidank wird ja den realen Gewinnen momentan keinerlei Bedeutung beigemessen und das alle Schätzungen auf den berühmt berüchtigten EBITDA bzw Proformabasis ( ex dieses, ex jenes, usw.) basieren......Ansonsten wäre das KGV ( wenn es denn überhaupt vorhanden wäre ) auch zu schockierend... Gut zu wissen das einige der Experten den Markt immer noch als "billig" betiteln..... Wenn man die richtige "Proformakalkulation" (siehe What are pro formaearnings? ) zugrunde legt sicher kein Problem.... Ich jedenfalls wundere mich schon lange nicht mehr das ich den Gewinnausweis nach der einheitlichen Bilanzierungsvorschrift GAAP nur nach lagem suchen im Kleingedruckten der Quartalsberichte finden kann..... Vor alternativen Analysten und Unternehmenskreationen wie EBITDA ( oftmal noch versüßt durch andere "außerordentliche" Belastungen ) usw. kann man sich in der tagtäglichen Berichterstattung hingegen kaum retten.....;-)
Alternative yardsticks for US earnings tell different stories By Paul Marson via FT

Every quarter, US companies publish their results under the defined US GAAP accounting rules. These results are labelled "reported earnings".

However, the most commonly looked at form of earnings are adjusted "operating earnings" on which companies prefer to focus as they onsider these better capture the underlying trend in activity

Adjusted operating earnings exclude non-recurring expenses such as restructuring charges, asset sales gains, major litigation charges, goodwill right downs and other write-offs.
While reported earnings are based on strict accounting rules, adjusted operating earnings are at the discretion of companies because there is no defined set of exclusions
Neither measure is perfect but with adjusted operating earnings, exclusions are currently so large that information about the true state of companies (and therefore the market as a whole) is being excluded.


These exclusions have reached the level where the gap between adjusted operating earnings and reported earnings is so wide that they deliver different messages on the state of US corporates.


Today reported earnings per share for the S&P 500 companies gathered by Standard & Poor's is $7.2 per share, down 91 per cent from the 2007 peak.

On an adjusted operating basis, earnings are $61.2, down 34 per cent from the 2007 peak.

This $54 gap is a record.

How has this come about? Much of the difference between adjusted operating earnings and reported earnings is caused by massive writedowns in the financial sector. However, outside the financial sectors write-offs are also at record highs as corporates are eager to toss out impaired assets during periods of stress.


Furthermore, when looking at adjusted operating earnings, it seems that most US corporates managed to beat their analyst estimates thanks to production and job cuts.

Friday, July 31, 2009

More On "The Less Bad Is Good" Mantra.......

The perfect fit to yesterdays post But Still Better Than Expected........ ....

Paßt wie die Faust aufs Auge zum gestrigen Post But Still Better Than Expected........

[cartoon+spin+bull+vs+bear.jpg]

Refining, the weakest link in the recovery Stephen Schork via FT Alphaville

Demand, not only for gasoline, but for other major products markets as well, is going the wrong way, i.e. from the top left to the bottom right on the charts. Thus, Big Oil is straining under the weight of poor margins.

It is now hard to reconcile these earnings reports, demand was lousy in the second quarter (and it not any better today). Yet, this market was being fed a fantastic lie back then… the less bad is good mantra.

Thus, whereas spot crude oil on the NYMEX finished the first quarter just below $50 a barrel (49.66) it finished the second quarter just below $70 (69.89). Crude oil rallied 40 percent as profits at the world’s largest oil companies were tumbling.

Why?

Because this market wanted to ignore the obvious and lull itself to sleep with silly pseudo-intellectual catchphrases… green shoots, crocuses, mustard seeds and this season’s rookie of the year… the second derivative.

Thus, while we were led to believe that demand for oil was rising in the second quarter, hence the justification for that 40 percent surge on the NYMEX, we now have the balance sheets from Exxon, Shell et al. that prove it was a lie.

Look at the screenshot of headlines we pasted on the top of today’s report. Profits for Big Oil are down as demand is at generational lows.

However, look at the very first headline, the NYMEX was higher esterday because “… corporate earnings boost confidence…”

Huh?

According to this one article, demand for oil and therefore profits for oil companies are down, but the NYMEX rallied yesterday because Motorola (mobile phone maker) had a smaller than projected loss and Calphalon (cookware) and Paper Mate (writing instruments) had better than expected profits

. Bloomberg screenshot headlines

You really cannot make this up......

Das ist so absurd das man sich unweigerlich fragt ob wir schon wieder den 1. April haben.... :-)