Showing posts with label profit margins. Show all posts

Sunday, July 11, 2010

Hussman & Hester vs Wall Street Finest.......

Once more brilliant "Anti Spin" & almost a rant from the usually polite Hussman.....Spot on with my take Of Course It Is Still A Good Time To Buy, Buy, Buy..... when it comes to Wall Street Finest.....
There maybe are legitimate reasons to buy stocks, but a favourable opinion from "Wall Street Finest" should definitely not play any role among your screening process .... Except you use them as a "contrary indicator".... ;-)
Einmal mehr deutliche Worte vom ansonsten doch recht zurückhaltenden Hussman....Eine erstklassige Ergänzung zu meinem früheren Posting Of Course It Is Still A Good Time To Buy, Buy, Buy.....
Grundsätzlich mag es ja durchaus gute Gründe die für Aktien sprechen geben, man sollte aber sicherstellen das die Einschätzungen der "Experten" beim Auswahlprozess keinerlei Rolle spielen....Es sei denn man nutzt sie als Kontraindikator.... ;-)

H/T Randy Glasbergen Collection

Misallocating resources John Hussman
On a valuation basis, the S&P 500 remains about 40% above historical norms on the basis of normalized earnings. The disparity between our valuation assessment and the putative undervaluation being touted by Wall Street analysts is so great that a few remarks are in order. First, virtually every assessment that "stocks are cheap" here is based on the ratio of the S&P 500 to year-ahead operating earnings estimates, and often comes with a comparison of the resulting "earnings yield" with the depressed 10-year Treasury yield. What's fascinating about this is that this is the same basis on which analysts deemed stocks to be about 40% undervalued just prior to the 2007 top, following which the market plunged by more than half.

To properly understand the price-to-forward operating earnings ratio, you have to recognize that operating earnings exclude a whole host of charges - what some observers correctly call "recurring non-recurring" charges. These include large and often quite regular losses that the companies deem, often on the thinnest basis, to be detached from their core business - even if the losses are directly related to their core business.
More on this topic in "Reported Earnings vs Operating Earnings"

Mehr zum Thema in "Reported Earnings vs Operating Earnings"

When you hear analysts say that the historical average P/E ratio is about 15, you have to recognize that this is the normal P/E based on trailing 12-month earnings after subtracting all writeoffs and other charges. Forward operating earnings are invariably much higher, and it turns out that the comparable historical norm, as I discuss in that 2007 piece, is only about 12. If you exclude the late 1990's bubble valuations, you get a historical norm closer to 11.5. The 1982 and 1974 market lows occurred at about 6 times estimated forward operating earnings

A final observation is crucial. Current forward operating earnings estimates assume profit margins for the S&P 500 companies that are nearly 50% above their long-term historical norms. While we did observe such profit margins for a brief shining moment in 2007, profit margins are extraordinarily cyclical. Investors will walk themselves over a cliff if they price stocks as if profit margins, going forward, will be dramatically and sustainably higher than U.S. companies achieved in all of market history.

They also ignore the large percentage of reported earnings that are actually quietly distributed to corporate insiders through the issuance of stock and options.

They blindly accept that "share repurchases" are somehow a pleasant distribution of earnings, whereas the majority of share repurchases are actually made by companies to do nothing more than offset the dilution from stock shares and options granted to insiders.

A good question to ask in the years ahead, immediately after profits are reported, is "how much of this figure is actually delivered to shareholders?" If you've been attentive over the past decade, the answer turns out to be much closer to the dividend yield than to the operating earnings yield that companies have reported.

For a moment, at least, it is good to be a corporate insider, particularly at major financial companies.

First, you get to report productivity gains and "operating profits" - not by making smart investments in productive assets, but instead by writing up debt thanks to Treasury intervention, by misstating your balance sheet thanks to FASB changes last year, and at industrial firms, by cutting the number of workers per unit of capital.

Next, you quietly write off large losses on bad investments and unrecoverable loans as "extraordinary expenses," to which investors pay no notice.

And to add insult to injury, you deliver a significant portion of the remaining profits to yourself as "incentive compensation," followed by buybacks of stock to offset the dilution, which investors actually cheer because they don't realize they've been taken for suckers.

Wall Street Earnings Expectations Ignore Economic Divergences Bill Hester / Hussman Funds

The graph below attempts to contrast the erosion in the global PMI indexes against the rising optimism of stock analysts.

Six series of data are plotted: the changes in earnings expected for the companies in the S&P 500 and the Euro Stoxx Index, and four PMI indexes for the US, the Euro area, Germany, and China. Each of the series is indexed to 100 in April, the month where most of the PMI data peaked.

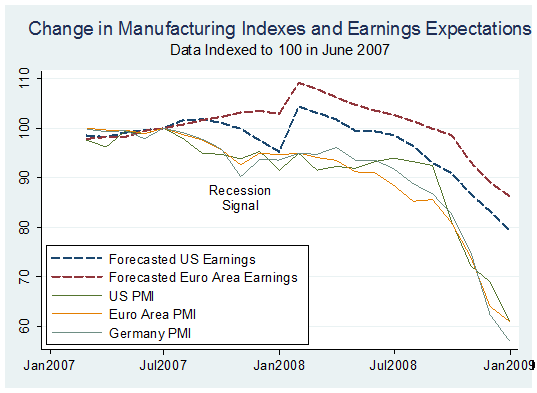
Now take a look at the Chart showing the period between 2007 and 2008 using the same indices.... I highly recommend to read the entire links.... There is much more.....

Hier zum Vergleich der identische Chart für die Zeit von 2007 bis 2008...... Empfehle die kompletten Links zu lesen... Wie üblich findet man dort noch deutlich mehr "Anti Spin"......

UPDATE:

RARE INTERVIEW WITH JOHN HUSSMAN: WHY HE IS BEARISH RIGHT NOW PragCap

Stocks Expected To See 12% Increase In Revenues In Q2, 41% Increase In EPS, And A Summary Outlook From Rosenberg ZH

As for all of 2010, the consensus is at $82 operating EPS, and for a new record to be reached in 2011, at $96 — breaking the record of $88 three years ago. Good luck in seeing a further 30% increase in profits with nominal GDP rising at a 3.0-4.0% annual rate at best in the next six quarters and at a time when margins are already back to cycle peaks.
For the full John Hussman archive visit the blogroll.....

Für eine komplette Auflistung der gesammelten Werke von Joghn Hussman bitte Blogroll beachten.....

Tuesday, June 1, 2010

Tony Dwyer Is Not Alone..........Of Course It Is Still A Good Time To Buy, Buy, Buy.....

What a "surprise"......Keep the following stats in mind when the daily spin "stocks are cheap on forward pe´s" is hitting the MSM... If you want to hear the "rationale" for a 2000 S&P target in 2013 visit Tony Dwyer & his "brilliant playbook" UPDATE: A guy named Altucher is almost as good It's Not a 'V', It's Even Better, Look for New Highs by 2012 .... There maybe are legitimate reasons to buy stocks, but a favourable opinion from "Wall Street Finest" should definitely not play any role among your screening process .... Except you use them as a "contrary indicator".... ;-)

Welch "Überraschung"......Behaltet die nachfolgenden Daten im Hinterkopf wenn es wie tagtäglich in den Medien und auch der Fachpresse gebehtsmühlenartig wieder heißt "das Aktien auf Bewertung der 2011er Gewinne günstig sind"..... Ein eindrucksvolles "Schauspiel" in dieser Disziplin bietet Tony Dwyer mitsamt seinem "brillianten Playbook" für sein 2000 S&P Ziel im Jahr 2013 UPDATE: Dieser Typ ist mindestens ebenbürtig It's Not a 'V', It's Even Better, Look for New Highs by 2012..... Grundsätzlich mag es ja durchaus gute Gründe die für Aktien sprechen geben, man sollte aber sicherstellen das die Einschätzungen der "Experten" beim Auswahlprozess keinerlei Rolle spielen....Es sei denn man nutzt sie als Kontraindikator.... ;-)


Bespoke
Bloomberg surveys sell-side Wall Street strategists on a weekly basis for their year-end S&P 500 price targets. At the start of 2010, the average year-end S&P 500 price target was 1,225, which would have been a gain of just about 10%. As markets moved higher in the first quarter, strategists upped their year-end targets, and the current average target stands at 1,268. (In the table below, green shaded price targets are ones that have been increased so far this year. No strategists have lowered their targets since the start of the year.) A target of 1,268 translates into a gain of 13.68% for the year and 16.48% from current S&P 500 levels.

There are no strategists with year-end targets that are lower than the index's current levels.
Analysts Projecting 27% Gain in S&P 500 Defy El-Erian Bloomberg

Combined price estimates from more than 2,000 forecasters tracked by Bloomberg show the S&P 500 will rise 27 percent in the next year, the fastest projected rate since February 2009, data compiled by Bloomberg show.

The rally above 1,350 will be led by industries most tied to the economy, according to analysts who boosted individual share projections by an average of 0.9 percent in May, the 14th straight monthly increase.

Should analysts’ forecasts for a 27 percent gain in the S&P 500 come true, the gauge would climb to 1,360 by next May, the highest level since June 2008.

The real story here are not the S&P 500 targets from the "strategist" but that they have managed to increase the target since the beginning of the year.... Despite events like the Flash Crash ( "Cancel All Orders, Cancel All Orders....." ), "minor headwinds" when it comes to Sovereign Debt,China , for US companies an unfavourable strong $ , impact from the "Oil Spill" on drillers & still insolvent Banks it´s fair to say that ROSE COLORED GLASSES are still a must have item among way too many among "Wall Street Finest"... ;-)

Die eigentliche Botschaft sind nicht die angegebenen Kursziele, sondern vielmehr die Tatsache das diese trotz einiger unschöner Ereignisse die vermehrt seit Jahresbeginn aufgetaucht sind wie dem sog. Flash Crash ( "Cancel All Orders, Cancel All Orders....." ), "minimalen" Problemen wenn es um Sovereign Debt,China den für US Firmen ungünstigen "starken $" , seit dem BP GAU die Probleme der Ölförderer & die immer noch bemerkenswert schwachen Banken geht, munter fleissig angehoben worden sind..... Denke es ist keine Übertreibung zu sagen das eine ROSAROTE BRILLE unter etlichen von "Wall Street Finest" noch immer zur "Standartausrüstung" gehört.... ;-)

I´ll let "Mr. Anti Spin" David Rosenberg du some further "bashing"..... Do yourself a favour & subscribe to his free DAILY REALITY CHECK... SUPERB!

Überlasse es "Mr. Anti Spin" David Rosenberg noch mehr Wasser in den Wein zu gießen....Empfehle allen sich frei Haus die tägliche Dosis Rosenberg zu genehmigen....

"It’s also fascinating to read the “Ahead of the Tape” column in the WSJ today and to read about the fabulous earnings performance of U.S. companies — a revival built on a weak U.S. dollar, accelerating global growth, fiscal stimulus and a steep yield curve.

Meanwhile, the consensus has just now gone ahead and projected peak earnings for 2011 just as each of these main crutches are reversing course."

AMEN....

McKinsey: Equity Analysts Are Still Too Bullish via Barry

Moreover, analysts have been persistently overoptimistic for the past 25 years, with estimates ranging from 10 to 12 percent a year, compared with actual earnings growth of 6 percent.

Over this time frame, actual earnings growth surpassed forecasts in only two instances, both during the earnings recovery following a recession. On average, analysts’ forecasts have been almost 100 percent too high.”

This chart completes the not so glory picture when is comes to the credibility & reputation from "Wall Street Finest".... If you have the "guts" to read the "rationale" behind Goldmans bullsih call you should read Goldman: "We Raised S&P 500 EPS Estimates Despite Worst May Performance In Almost 50 Years"

Dieser Chart paßt hervorragend ins Bild unm das das wenig glorreiche Bild abrunden....Für alle die die Nerven haben und wissen möchten auf welchen "Modellen" die Schätzungen von Goldman basieren Goldman sollte Goldman: "We Raised S&P 500 EPS Estimates Despite Worst May Performance In Almost 50 Years" lesen....

UPDATE:

Profit-Margin Outlook for U.S. Is ‘Extremely Bad’: Chart of Day Bloomberg

Best Stocks Liked Least by Analysts Missing U.S. Gain Bloomberg

Monday, April 5, 2010

Profit Margins, Margin Debt & Margin Of Error.......

Combine the data points with the excellent When Risk-Return Makes No Sense: How To Deal With An Overvalued Market and it should be clear that Mr. Market is walking on very thin ice now... I must admit that this is my view since September/October......Cannot help but it at least smells a little bit like "Flucht In Sachwerte"... I still think that the risk / reward is far more favourable in GOLD... ;-)

Wenn man die folgenden Daten mit dem extrem lesenswerten When Risk-Return Makes No Sense: How To Deal With An Overvalued Market kombiniert wird klar das man sich momentan auf sehr dünnem Eis bewegt.... Muß gestehen das ich diese Ansicht seit dem September/Oktober vertrete.... So langsam kann man zumindest unterschwellig das Gefühl haben das zumindest in Teilen eine "Flucht In Sachwerte" eingesetzt hat.....Bin mehr denn je überzeugt das in Sachen Chance/Risiko die Aussichten für GOLD weitaus vielversprechender sind.... ;-)

William Hester / Hussman Funds
While earnings growth expectations are steep, sales growth expectations are more modest. Sales-per-share for S&P 500 companies is expected to grow about 5.5 percent this year and about 7 percent next year, according to forecasts. The difference between the growth rates of the top and bottom lines is implies a forecast for sharply rising operating profit margins. The graph below is updated from an earlier piece, and includes forecasts through the end of 2012. It plots the long-term level of S&P operating margins in blue. In red, I've plotted the operating margins currently being forecasted by analysts based on their projections for sales and earnings. Last October, analysts were about half way to pricing in profit margins that matched the record levels of 2007. Now, they are just about there.
David Rosenberg / Gluskin Sheff
As for 2011, the consensus is looking for $97 on S&P 500 operating EPS — we did $95 at the peak of the last cycle when the unemployment rate was at 4.5%, the industry CAPU rate was 81%, private sector credit xpanding at a 16.2% annual rate and nominal GDP at a 4.9% YoY pace.
So the consensus believes that barely two years into the second weakest post-recession recovery in the past six decades that we will actually get back to peak profit levels seems to be a tad outlandish.
Stock Market Rally Explained The Mess That Greenspan Made

Ad in the the Money & Investing section of today’s Wall Street Journal

Factoring in the tight junk spreads right now one must assume that looking at the next chart the "Margin Of Error" is probably "slim"......

Da momentan selbst historisch gesehen recht enge Junk Spreads vorherrschen muß man beim Anblick des nächsten Charts wohl unterstellen das in Sachen "Margin Of Error" wenig "Spielraum" bleibt.....

Investors really ♥ junk. We mean really. FT Alphaville

In most discussions of the high-yield bond market, historical spreads play a major role. But comparing spreads today to those of the past assumes that junk bonds are a constant entity over time. Unfortunately, junk is junkier today, as illustrated by this chart [at left] from last October’s Global Financial Stability Report.

The fraction of CCC or lower-rated bonds approximately doubled from early 2007 to early 2009. And according to a recent report from Fitch, the fraction at the end of 2009 was still 27%.

Debt ranked in the BB category gained 39.1 percent in the past 12 months, underperforming the CCC tier by 66 percentage points, according to Bank of America Merrill Lynch index data.


H/T EconomPicData

The "risk trade" is currently clearly not in the early innings....... Looks like the Mantra Bullish. No Matter What & the "Moon Trade" ( brilliant!) is still alive & kicking.... ;-)

Der sog. "Risikotrade" befindet sich sicher nicht mehr im "Anfangsstadium"..... Sieht so aus als wenn das Motto Bullish. No Matter What sowie Ladies and Gentlemen, We Are Trading On The Moon ( brilliant!) momentan noch immer zu greifen scheint...... ;-)+

UPDATE:

PARTS OF THIS MARKET ARE LOOKING IRRATIONAL PragCap

Why Young People Should Buy Stocks on Margin Time H/T Denninger

We just survived the worst debt-fueled binge since the Roaring '20s. Now two professors at Yale University are suggesting we introduce leverage into a new realm of our lives —our retirement portfolios. TIME's Barbara Kiviat asked economists Ian Ayres and Barry Nalebuff to explain themselves.

You are advocating that people in their 20s and early 30s take all of their retirement savings and buy stocks on margin. Can you explain why that's not as crazy as it sounds?

"It's not as crazy as it sounds because it helps people better diversify risk across time"

Read this twice....

UBS: EQUITY MARKET RISKS APPROACHING EXTREMES PragCap

Irrational Exuberance Is Here: VIX Lowest Since July 2007 As Options Speculation Highest Since Dot Com Days

The VIX has just hit the lowest level since July of 2007 as Sentiment Trader reports that "speculation in the options market has spiked to its highest levels since the spring of 2000."
As i´ve said, not in the early innings.....

Wie gesagt, nicht mehr im Anfangsstadium......

Friday, May 1, 2009

Abby Joseph Cohen 2009 vs Abby Joseph Cohen 2001.....Which Call Is Worse?

What´s a year without a "brilliant" call ( even more important the rationale behind the call ) from Abby Josef Cohen.....Just in time after a 30% plus (technical ) rally in the major indices worlwide.....In the past especially the calls from permabull Cohen were close to near and often long term market tops...... To my knowledge one of the better "contrary" indicators......

Was wäre ein Börsenjahr ohne Weisheiten von Abby Joseph Cohen.....Man beachte das brilliante Timing.... Rechtzeitig nachdem alle bedeutenden Indizes 30% und mehr gewonnen ( technisch bedingt ) haben..... Ein prima Kontraindikator. Die "Prognosen" vom Permabullen Cohen haben in der Vergangenheit zeitlich oft ein längfristiges Markthoch markiert...... Besonders wenn die Begründung für die avisierten Kursziele schon fast tragischkomischen Charakter haben bzw. man befürchten das die Schweinegrippe auch Wall Street erreicht hat...

Call 2001 just bevor the collapse:

bigger/größer

Hat tip Wall Street Follies

Call 2009 S&P 500 at 880:

Goldman Sachs’s Cohen Says S&P 500 May Surge to 1,050

May 1 (Bloomberg) -- The Standard & Poor’s 500 Index may jump 20 percent to 1,050 over the next six to 12 months as investors buy stocks trading at low valuations, said Abby Joseph Cohen, Goldman Sachs Group Inc.’s senior investment strategist.

> Low valuations....? "Fair value based on recession earnings" ( Quote Cohen ) ? She is probably using the following model showing the "high" quality of earnings ( backing out large parts of costs doing business like write downs, restructoring charges etc / see also the update at the end of the posting) or she is the only one thinking the Fed Model ( see "Fed Model" Knowing What Ain't True ) is usefull.....

> Niedrige Bewertungen.....? "Faire Bewertung die auf rezessionsgestählten Ergebnisprognosen basieren" ( Zitat Cohen )? Mag ja sein das sie Ihre Bewertungsmodelle auf der nachfolgenden Rechnungsmodellen basiert die an Kreativität ( "Sonderfaktoren wie Abschreibungen, Restrulturierungskosten usw werden ausgeklammert ) kaum zu überbieten sind ( siehe auch Update am Ende ). Denkbar auch das Sie als einzige dem Fed Modell ( siehe "Fed Model" Knowing What Ain't True ) glauben schenkt...........


“You could see the market sustain at these levels,” Cohen, 57, said in a Bloomberg Radio interview. “We’re going to set a new trading range much higher than the trading range in February and March.”

Cohen was replaced as Goldman Sachs’s chief forecaster for the U.S. stock market a year ago. She had been the second-most bullish Wall Street strategist at the start of 2008, a year when the S&P 500 tumbled 38 percent to 903.25 for the steepest annual loss in seven decades. Cohen predicted in December 2007 that the index would end last year at 1,675. David Kostin took her job.

At least i think her 2009/2010 call will be closer to the target than her over 40 percent miss for the 2008 December estimate...... :-)

Immerhin wird sie wohl Ihre 40% Zielverfehlung Ihrer letztjährigen Prognose verbessern können...... :-)

UPDATE:

This just in from David Rosenberg via Zero Hedge . I highly recommend to read the entire link. Compare this to the call from Cohen.....

Den nachfolgenden Link via Zero Hedge empfehle ich allen die das Kontrastprogramm zu Cohen lesen wollen. Eine realistische und fundierte Marteinschätzung von einem der auch die bisherigen Probleme vorhergesen hat ( David Rosenberg ).

The market, as a whole, cannot be considered cheap

In the meantime, earnings forecasts are being trimmed steadily for the balance of the year. In fact, forward P/E multiple of 15x operating and 30x on reported EPS are not that compelling. So, we do not have a strong valuation argument. We do not have a strong earnings argument.

Compare the following chart with the former S$P500 1675 target from Cohen......

Vergleicht den nachfolgenden Chart mit dem vorherigen Kursziel ( S&P 500 1675 ) von Cohen.....

via Chart Of The Day
While the stock market is up sharply since early March, the economy as well as corporate earnings continue to suffer. Today's chart helps provide some perspective as to the magnitude of the current economic decline. Today's chart illustrates that 12-month, as-reported S&P 500 earnings have declined over 90% over the past 20 months (with over 90% of S&P 500 companies having reported for Q1 2009), making this by far the largest decline on record (the data goes back to 1936). In fact, real earnings have dropped to a record low and if current estimates hold, Q3 2009 will see the first 12-month period during which S&P 500 earnings are negative.